Time-Location chart

APEX Linear Schedule

Elevate your project scheduling and visualization capabilities with the APEX Linear Schedule visual, the ultimate tool for Microsoft Power BI. This custom visual is purpose-built for linear project types like Tunnels, Railways, Roads, Pipelines, High-Rise Buildings, and more, allowing you to transform complex project schedules into easily digestible Time-Location format charts.

The APEX Linear Schedule eliminates the need for expensive third-party linear scheduling software. Say goodbye to training and hefty licensing costs. This Power BI visual lets you create time-location charts directly from Primavera P6, Microsoft Project or any spreadsheet table exports.

Key Features

Comprehensive Edit Pane

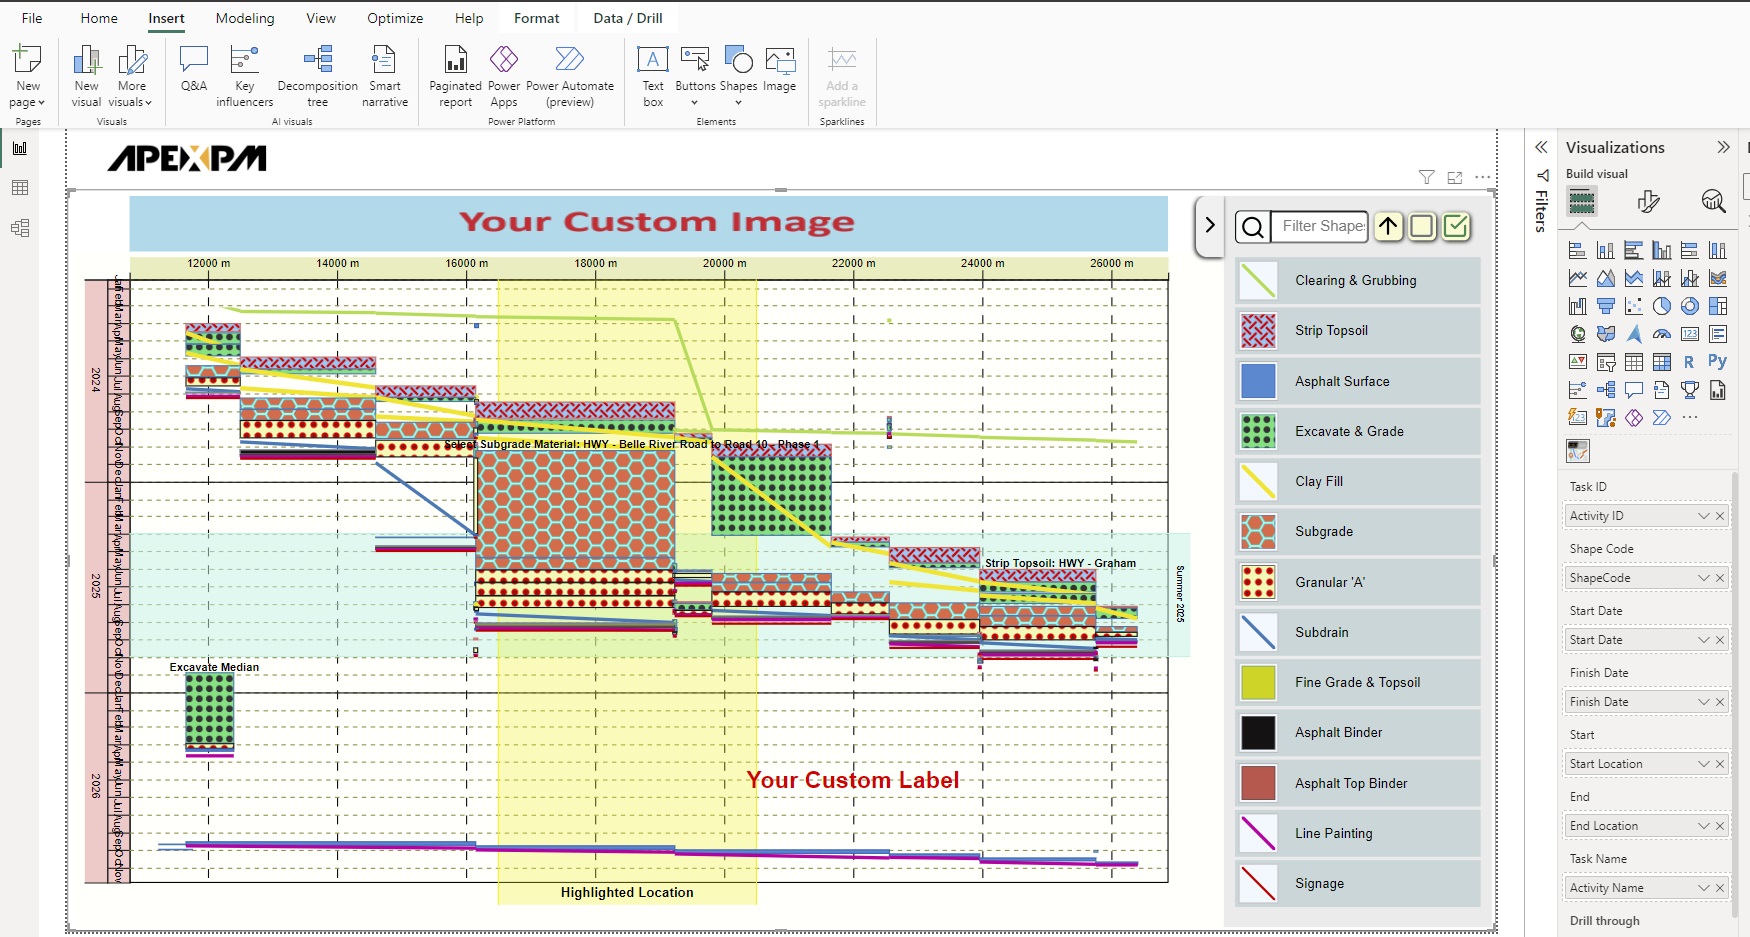
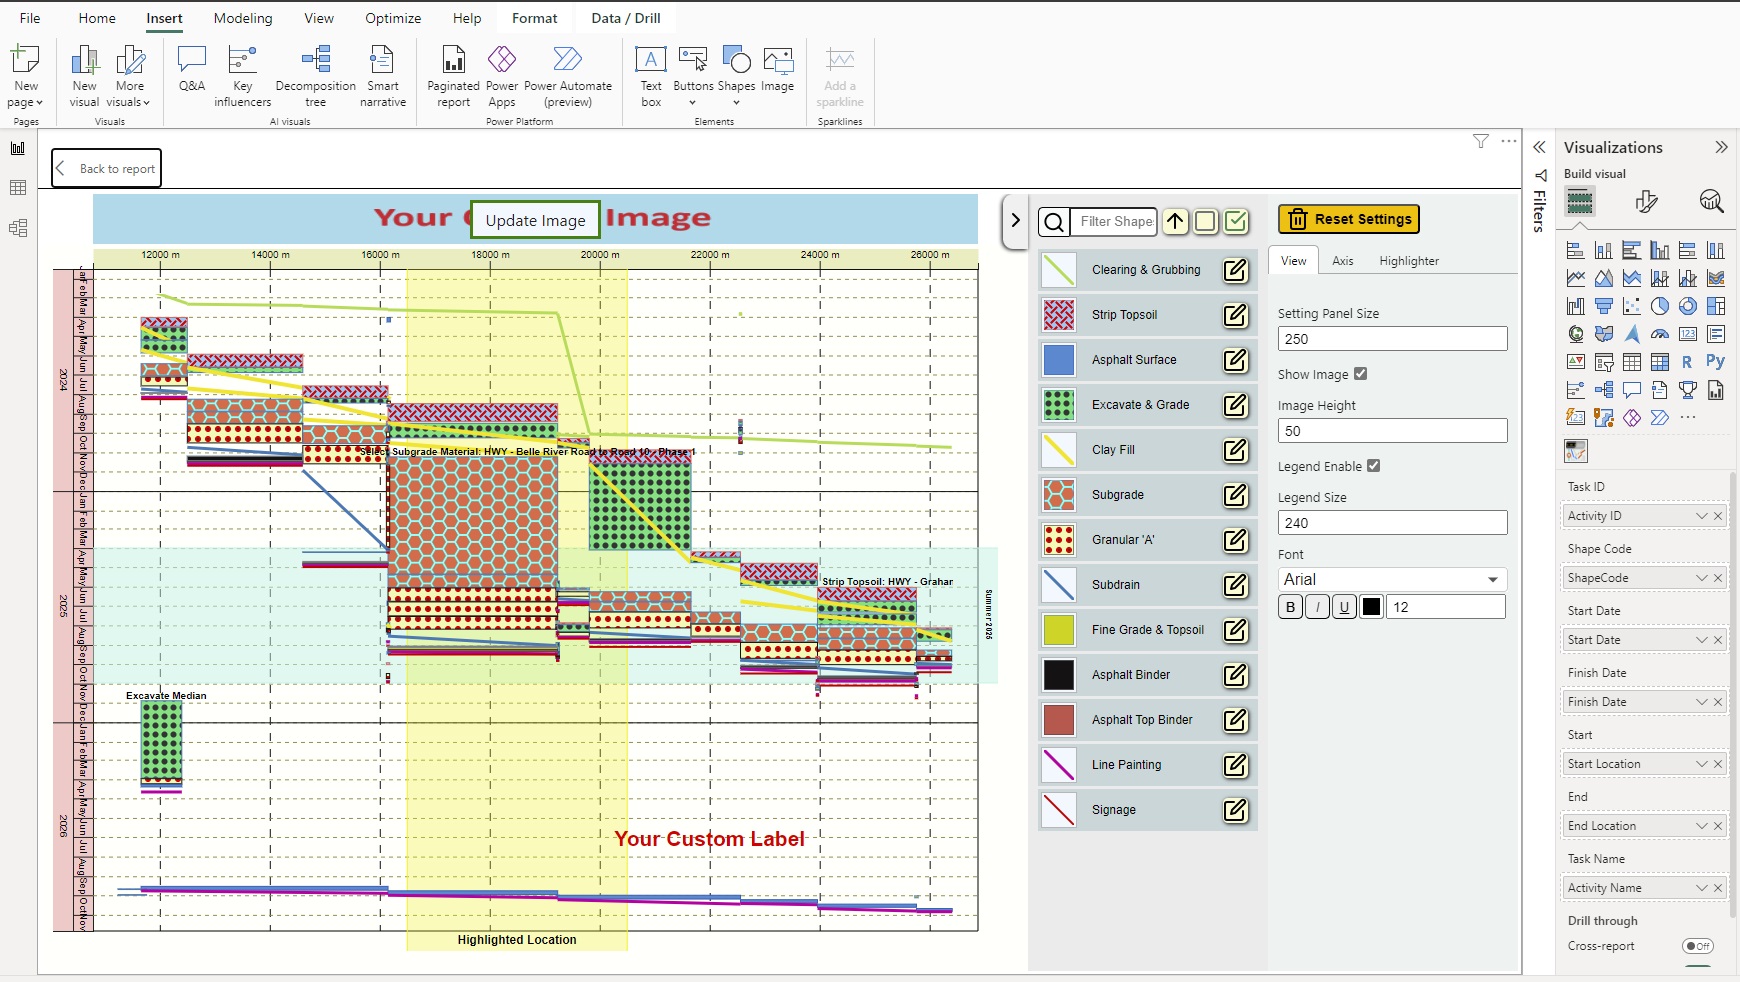
Customize project schedules with shape, order, and display options for activities

Zoom-In, Zoom-Out and Pan

Explore project timelines seamlessly using zoom and pan features for in-depth analysis or high-level overviews

Interaction Capability

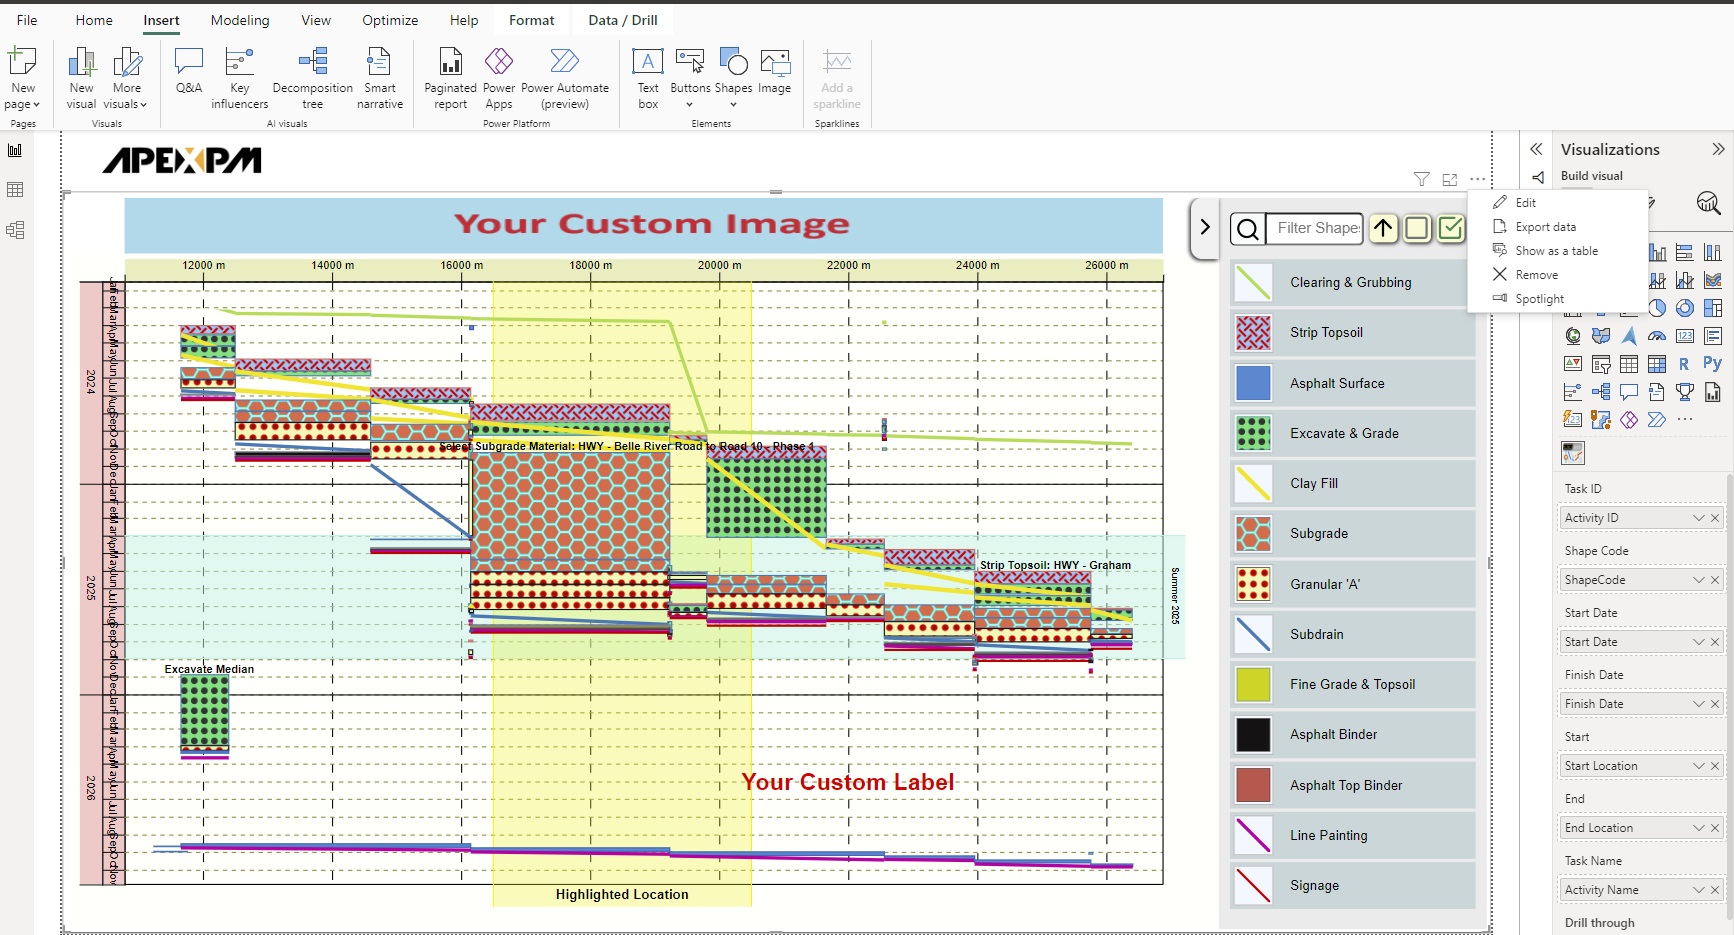
Link to other Power BI components for dynamic dashboards

Axis Reversal

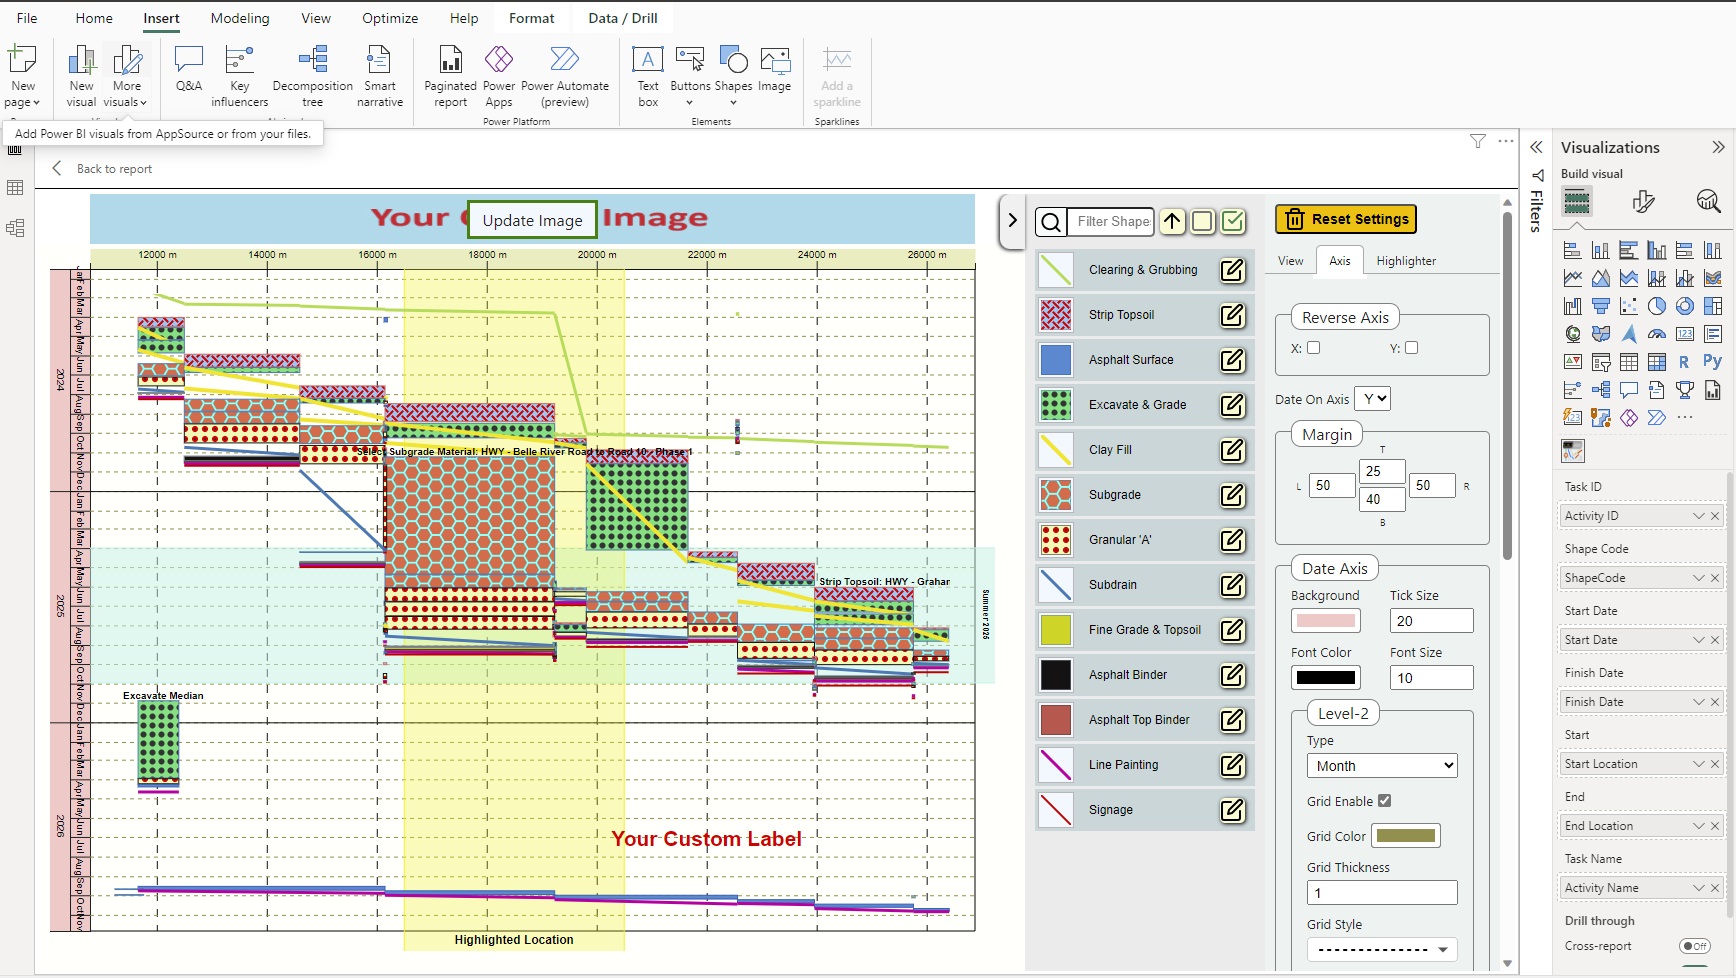
Reverse the axis to fit your project's orientation.

Add Custom Image & Labels

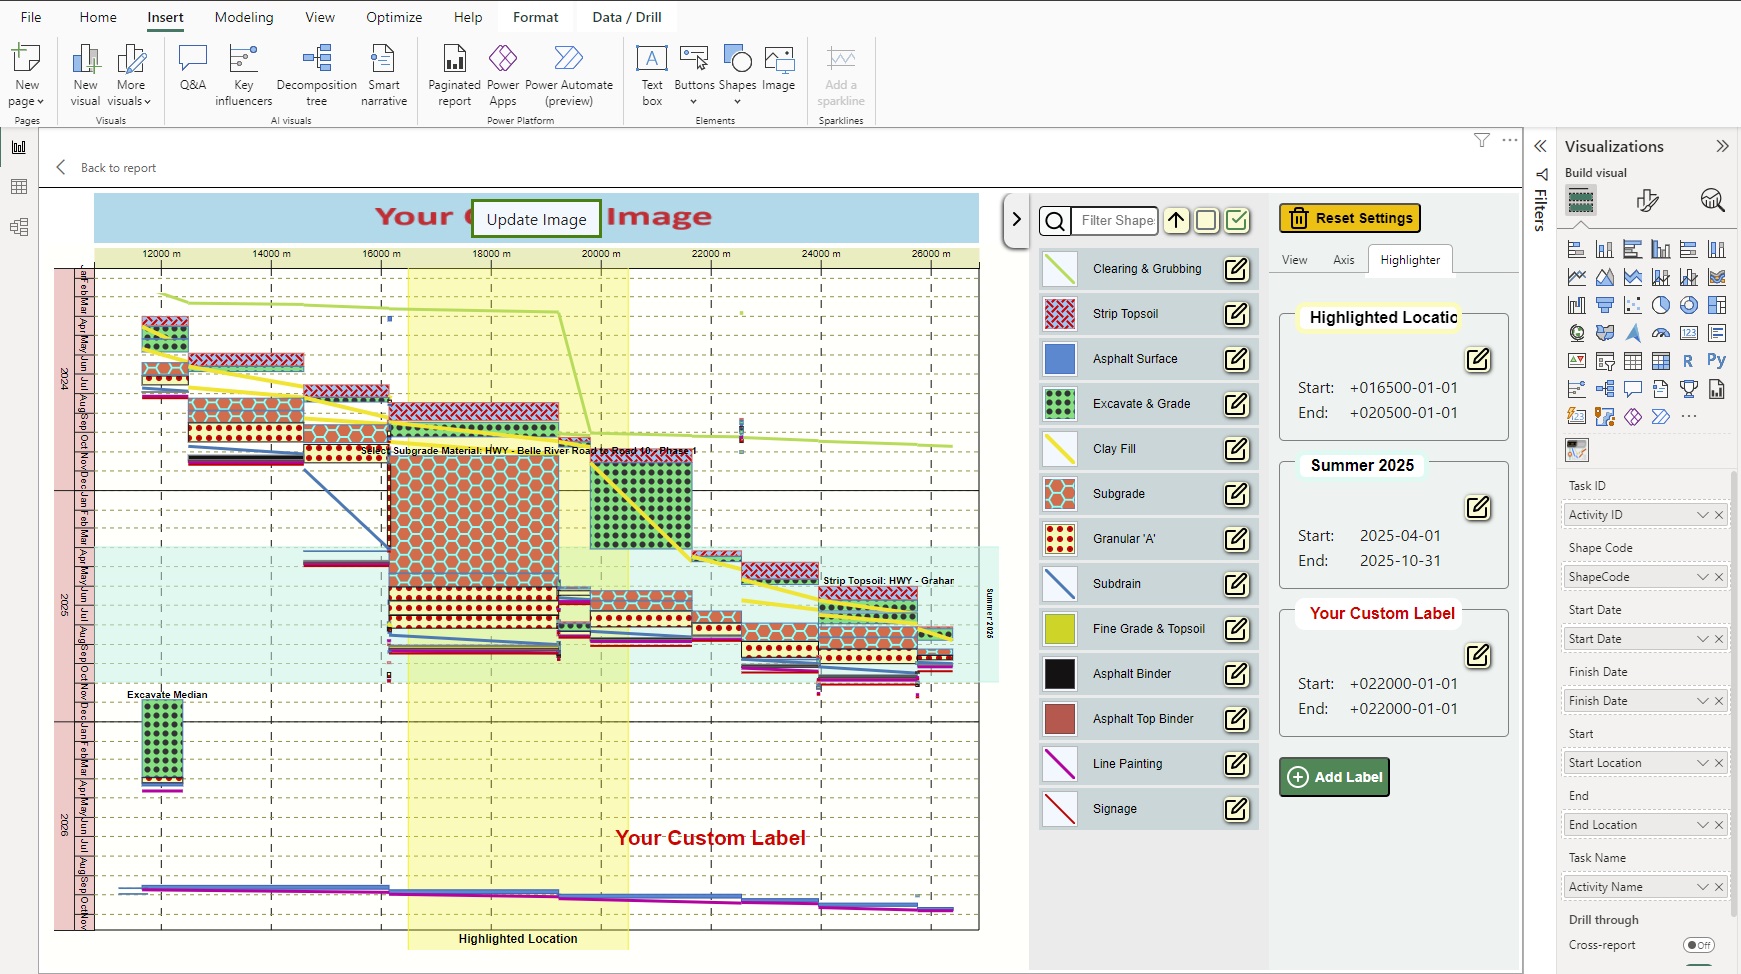
Displaying maps or blueprints. Place unlimited custom labels anywhere on the chart for additional context

Custom Tooltips

Offer vital insights and context through custom tooltips for timely access to relevant information

Purchasing

Download the free trial or purchase the APEX Linear Schedule directly from Microsoft

FAQ

This is a custom visual developed by Apex Project Management Inc. to be used inside Power BI for developing dashboards or reports. This visual produces Time-Location charts based on the existing project schedules, used for such linear projects as construction of tunnels, roads, bridges, railways, etc.

The visual requires data in a structured format. This includes activities' start date, end date, start location, end location and shape code. You can import data manually or from a dataset available in your workspace.

You can use all the data sources supported by Power BI. To import data from Primavera P6, you have the option to either connect Power BI directly to the Primavera P6 database, or import it through XER / Excel files. Since importing XER file is not supported by Power BI, it should be imported as a text/CSV file.

You can download this visual from Microsoft AppSource at Apex Linear Schedule (microsoft.com).

Also, you can download a free sample PBIX file, available on the Microsoft AppSource, that showcases some capabilities of the visual in desktop environment.

To make changes and publish the visual you should purchase a valid license.

Microsoft oversees and manages the licensing process.

Yes, and thanks to this feature, you can mix the full power of DAX into your visual.

Yes, you can customize the visual based on your data. This includes defining the shape settings and orders for each activity type and selecting which items to display on the chart.

You can see the pricing list here:

Apex Linear Schedule (microsoft.com)

If you need any help or assistance, please send us a message via the below link:

Contact – Apex (apexpmapps.com)

We focus on helping organizations with innovative tools and solutions in data analysis.